Getty Images
11 key Agile metrics to ensure effective measurement
Agile metrics are crucial to help software development teams track speed, efficiency and quality. Here are some important ones, and how to combine them for best results.
Agile metrics are essential for tracking speed, efficiency and quality in software development. We all know that what gets measured gets improved. However, Agile metrics are often misunderstood, misapplied or misjudged, which can undermine their purpose.
Let's take a closer look at some key Agile metrics and their potential strengths and limitations:
- Lead time.
- Feature cycle time.
- Velocity.
- Sprint burndown.
- Flow efficiency.
- Code Net Promoter Score.
- Code coverage.
- Escaped defects.
- Code review completion rate.
- Committed vs. completed tasks.
- Happiness index.
Lead time
Lead time measures the duration from when a customer requests a feature to its delivery. It reflects the overall efficiency of the development pipeline to help identify delays and optimize workflows. Shorter lead times indicate higher efficiency and responsiveness to customer needs.
However, in large organizations, lead time can be misleading. It does not differentiate between active work and idle waiting periods, nor does it consider task complexity or workload variability. This linear nature limits its usefulness as a standalone Agile metric.
Feature cycle time
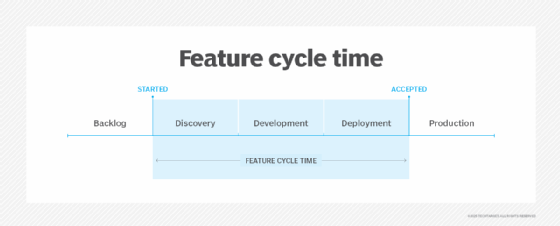
Feature cycle time (FCT) tracks the time it takes for a team to complete an individual feature. Shorter cycle times indicate streamlined workflows, which enable better delivery estimates and build stakeholder trust. FCT also helps identify bottlenecks in feature development.
Despite its benefits, FCT can be problematic if misused. Many organizations set FCT targets without ensuring the features themselves add value, which reduces the metric's relevance and purpose. Moreover, this metric overlooks systemic inefficiencies, fails to account for innovation and cannot adapt to varying levels of task complexity, which makes it less suitable for Agile environments.

Velocity
Velocity measures the amount of work a team completes during a sprint, typically in story points. With this internal tool, teams can better understand their capacity, set realistic goals and predict future deliveries. They can also use it to promote innovation by aiming for higher velocity targets.
Unfortunately, velocity is often misused, such as in performance reviews or cross-team comparisons. Differences in estimation methods and skills make it difficult to compare across teams. An overemphasis on velocity can also lead to burnout or reduced quality. It works best when a team uses it solely for self-assessment.
Sprint burndown
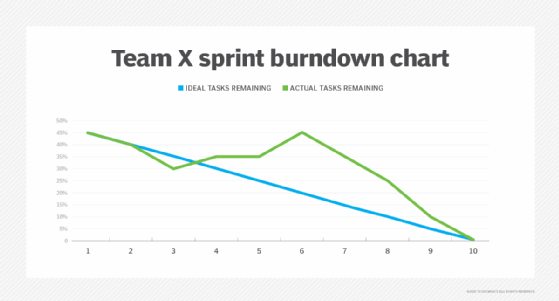
Sprint burndown charts visualize the progress of tasks within a sprint by showing work completed versus work remaining, which enables teams to identify delays or scope changes early and make timely corrections. It keeps teams focused on sprint objectives and timelines.
However, most teams work on multiple stories simultaneously, which can skew the metric. If a team completes all stories near the end of a sprint, this creates a misleading view of progress. Burndown works best when teams collaborate on one story at a time, but this is often not practiced widely.

Flow efficiency
Flow efficiency measures the percentage of time a team spends on value-adding activities versus idle or waiting periods. This helps teams identify inefficiencies and optimize workflows, accelerating task completion while maintaining collaboration.
Despite its utility, flow efficiency has limitations in complex adaptive environments. Too much focus on active versus idle time oversimplifies work dynamics, especially in large organizations. Without context such as dependencies this metric can be misused; individuals or teams can be blamed for slowing things down. It is more suitable for repetitive tasks than creative or complex adaptive work which is at the heart of any Agile adoption.
Code Net Promoter Score
Code Net Promoter Score (NPS) measures how likely team members are to recommend a codebase after reviews, as a reflection of its readability, maintainability and satisfaction. It encourages clean, modular coding practices and identifies areas for improvement.
However, this metric is highly subjective and prone to biases. While it promotes good coding practices, teams should not rely on it too heavily without considering the quality and context of feedback.
Code coverage
Code coverage measures the percentage of code executed during tests, ensuring that most parts of the codebase are validated. It can help detect bugs early in the development cycle.
However, high coverage does not guarantee thorough testing. Tests might merely execute code without verifying its correctness and leave critical flaws undetected. Overemphasis on this metric can lead to superficial tests that focus on achieving high coverage rather than meaningful validations.
Escaped defects
Escaped defects track the number of bugs discovered after release, which provides insights into testing gaps. A low number of escaped defects can indicate effective quality control, but may also reflect insufficient testing that failed to uncover hidden issues.
This metric is valuable when evaluated alongside the breadth of the testing strategy, the application's complexity and real-world usage patterns. Alone, it can be misleading.
Code review completion rate
This metric tracks how often a team reviews code changes before merging them. Multiple reviews bring diverse perspectives, increasing the chances of catching issues and improving code quality. This also fosters team collaboration and shared ownership.
However, high completion rates do not necessarily indicate rigorous reviews. It is crucial to focus on the quality of the reviews rather than the numbers.
Committed vs. completed tasks
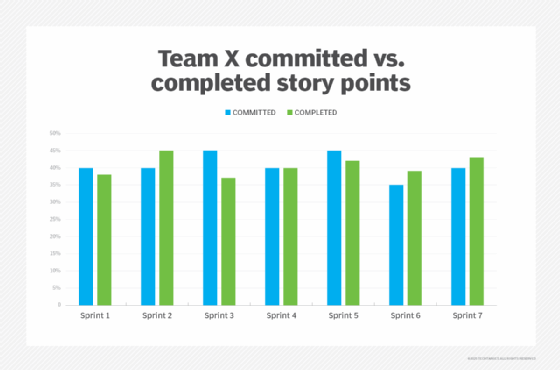
This metric compares planned versus delivered work as a way to measure estimation accuracy and team reliability. A team that consistently meets commitments indicates reliable planning, while frequent under- or over-delivery highlights overly ambitious or conservative estimates.
While useful, this metric can lead to gaming of estimates if misused, which undermines its value.

Happiness index
The happiness index measures team satisfaction with work and processes, which promotes well-being and engagement. Essentially, this reflects morale.
However, it is effectively a vanity metric, subjective and often dismissed as superficial. It may not directly correlate with productivity or outcomes. As happy as it may sound, don't use it.
Combine Agile metrics for best results
Each Agile metric has its strengths and limitations, and no single metric can provide a complete picture. When used in isolation, metrics may offer skewed insights. Instead, look for complementary combinations of Agile metrics:
- Velocity can measure productivity, but pairing it with code quality metrics such as code NPS and review completion rates can provide a more holistic view of a team's performance.
- Pairing overall lead time with specific feature cycle time provides a granular view of efficiency at both project and feature levels.
- A combination of committed vs. completed and sprint burndown tracks how well a team adheres to planned sprint goals while highlighting trends in completion rates.
- Flow efficiency and feature cycle time together can identify inefficiencies while accounting for task complexity. Similarly, escaped defects and code coverage can reveal testing gaps while ensuring meaningful validations.
For best results, teams should look at combinations of Agile metrics to best gauge the effectiveness of their Agile efforts, address blind spots and make better decisions.
Ashok P. Singh is a product coach, author and entrepreneur who helps companies simplify their agile software development and product development.


