Fotolia
5 Java performance profiling tips to help tune your JVM
Check out these Java performance tips, such as which profiling tool to use, what data you need to save as part of your CI/CD pipeline and how to incorporate AI.
The best way to optimize JVM throughput and avoid runtime bottlenecks is to make Java performance profiling a key part of your team's continuous development and deployment (CI/CD) strategy. Here are five Java performance profiling tips and best practices that will help you get the most out of both your local hardware and your cloud-hosted runtime environments.
1. Never turn off Java performance profiling
Java Flight Recorder is an incredibly efficient Java performance profiling tool built directly into the JVM. It's lightweight and has a minimal impact on running applications.
The default setting has less than a 1% impact on performance, while even the most extreme data gathering settings consume little more than 2%. Given the fact that no production server should ever experience a 50% load for any extended period of time, there should always be enough resources available to keep Java Flight Recorder running in the background.
The benefit to this configuration is that when a JVM crash occurs, or an application encounters a catastrophic runtime failure, a recording of all the events that led up to the disaster is available for inspection. Even on a production system under heavy load, a Java performance profiler should always be running. In fact, the times when a JVM is under extreme load is when the metrics garnered from a Java performance profiling tool are most useful.
2. Know when to choose sampling over instrumentation
There are two different approaches to monitoring and profiling the JVM: sampling and instrumentation.
A Java performance profiler that uses a sampling approach will place a more predictable load on the JVM at runtime. As a result, a sampling-based profiler is best to use when searching for patterns in the JVM's bytecode invocations.
Instrumentation profilers are more exact and can be more surgical in their application. With instrumentation, software architects add additional code or components into the system. They add these instruments into spots they believe are likely to be sources of performance problems. Because instruments are inserted into application code or embedded within the JVM, they get triggered every time they are encountered.
When you have a good understanding of what the problem is and where the problem lives in the codebase, instrumentation-based profilers tend to be more effective.
A strategic use of both sampling and instrumentation-based profilers will lead to the best Java performance optimization outcomes.
Learn how to get started with Java Flight Recorder.
3. Augment JVM performance problem analysis with AI
Be it a memory leak or a thread deadlock, most Java performance problems follow well-known patterns of behavior. Before investing a great deal of time henpecking a JVM heap histogram or inspecting Java GC pause times, run your Java performance profiler data through an analytics tool that can apply some degree of AI to the file.
Most Java performance profiling tools will be able to quickly categorize the type of bottleneck that plagues your application, going so far as to identify the actual line of code that is slowing throughput and latency down.

4. Keep performance benchmarks in version control
A history of performance data will help you identify patterns in your Java performance metrics.
Create a performance test suite for your applications, run it as part of every continuous integration build, and ensure you have Java Flight Recorder turned on in the background. Then save the generated Flight Recorder data file in Git or GitHub as part of the CI/CD build.
This Java performance profiling strategy not only creates a performance benchmark for your applications, but it also gives you a history over which you can view how trends emerge over time. You might not be able to identify a looming performance issue from one sprint to the next, but a comparison of JVM profiler data over a series of weeks or months will help to unearth patterns.
Furthermore, tell developers that if performance metrics fall out of acceptable ranges, then it's considered a broken build. Get developers thinking about nonfunctional requirements like performance and security early on in the development lifecycle.
5. Modernize your Java profiling tools
Don't get set in your ways when it comes to Java performance profiling tools.
The tools that may have been effective at troubleshooting applications deployed to WebSphere or Tomcat servers 10 years ago aren't going to be as effective at troubleshooting microservices-based applications deployed to Docker containers. The world of application development, design and deployment has changed greatly over the last 10 years, and the Java performance profiling tools you use need to change with it.
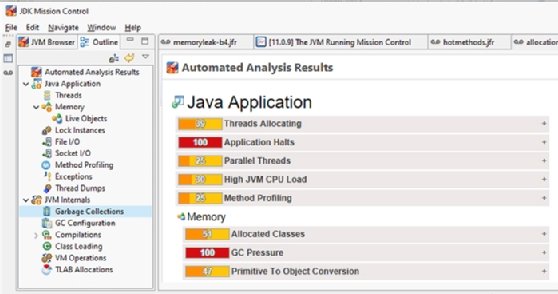
VisualVM remains a popular Java performance profiling and monitoring tool, but new analysis tools like Java Mission Control provide updated ways to visualize and inspect JVM metrics. And many vendors specialize in the analysis of JVM runtimes when bytecode is packaged inside of Docker containers and deployed to Kubernetes clusters. Always make sure the analytics tool you use matches your Java performance profiling needs.
Java performance profiling tips and tricks
In review, the five tips to help you get the most out of your Java performance profiling tools and routines are:
- Never turn off Java performance profiling.
- Know when to choose sampling over instrumentation.
- Augment JVM performance problem analysis with AI.
- Keep benchmarks in version control.
- Modernize your Java profiling tools.
Stick with these Java performance profiling tips and stay one step ahead of impending JVM bottlenecks that threaten to slow your application's throughput down.


