

Precision and recall are two of the most important metrics used to evaluate classification models.
The simplest distinction is this: precision measures how trustworthy positive predictions are, while recall measures how many of the actual positive cases the model successfully finds.
Precision is affected by false positives. Recall is affected by false negatives. Understanding that distinction makes the formulas much easier to remember.
Precision vs. recall
Precision answers this question:
Of everything the model predicted as positive, how many predictions were actually correct?
Recall answers a different question:
Of everything that was actually positive, how many cases did the model successfully identify?
The formulas are:
Precision = TP / (TP + FP)

Recall = TP / (TP + FN)
Here, TP means true positives, FP means false positives and FN means false negatives.
The confusion matrix behind precision and recall
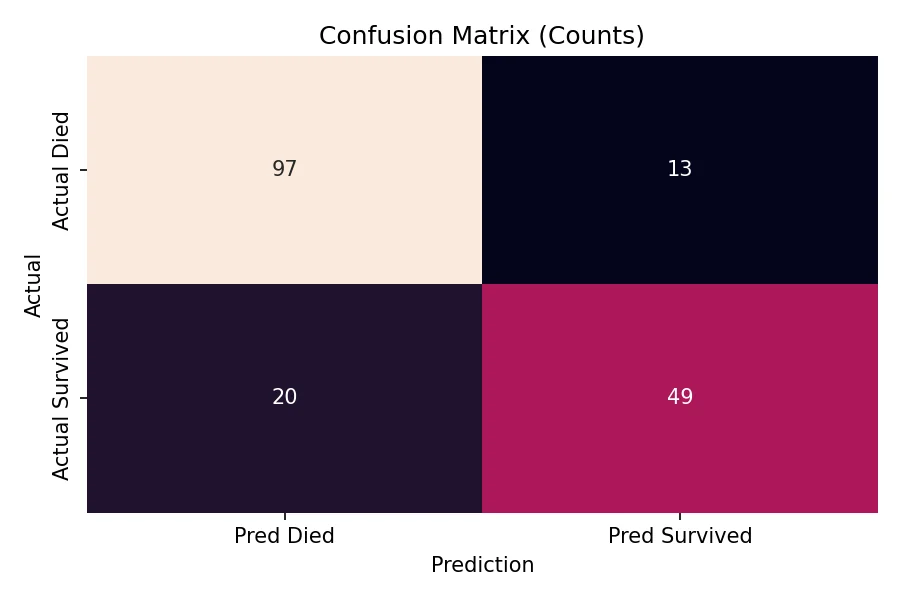
Precision and recall are derived from a classification model's confusion matrix:
| Actually positive | Actually negative | |
|---|---|---|
| Predicted positive | True positive (TP) | False positive (FP) |
| Predicted negative | False negative (FN) | True negative (TN) |
A true positive is a positive prediction that was correct. A false positive is a positive prediction that was wrong. A false negative is an actual positive case the model missed.
Notice that true negatives do not appear in either the precision or recall formula. That is one reason these metrics are especially useful when the positive class is rare or more important than the negative class.
A simple precision and recall example
Imagine a model predicts which visitors to a website will subscribe to a newsletter. Out of 100 visitors, 20 actually subscribe.
Suppose the model predicts exactly those 20 subscribers and nobody else. The confusion matrix contains:
- 20 true positives;
- 0 false positives;
- 0 false negatives; and
- 80 true negatives.
Both metrics are perfect:
Precision = 20 / (20 + 0) = 100%

Recall = 20 / (20 + 0) = 100%
Real models rarely perform this perfectly, which is where the distinction between precision and recall becomes important.
High recall and low precision example
Now imagine the model predicts that all 100 visitors will subscribe, but only 20 actually do.
The model finds every real subscriber, so it has 20 true positives and no false negatives. However, it also incorrectly labels 80 non-subscribers as subscribers.
- True positives: 20
- False positives: 80
- False negatives: 0
- True negatives: 0
Precision = 20 / (20 + 80) = 20%

Recall = 20 / (20 + 0) = 100%
This model has perfect recall because it missed none of the positive cases. Its precision is poor because most of its positive predictions were wrong.
This illustrates an important point: 100% recall does not mean a model is 100% accurate. A classifier can achieve perfect recall simply by predicting everything as positive, although doing so will often destroy precision.
High precision and low recall example
Now consider the opposite model. Of the 20 people who actually subscribe, suppose the model predicts only one subscriber. That one prediction is correct.
- True positives: 1
- False positives: 0
- False negatives: 19
- True negatives: 80
The resulting metrics are:
Precision = 1 / (1 + 0) = 100%

Recall = 1 / (1 + 19) = 5%
Every positive prediction was correct, so precision is perfect. However, the model found only one of the 20 actual subscribers, so recall is just 5%.
This demonstrates the opposite lesson: 100% precision does not mean the model is good. A model can be extremely conservative about making positive predictions and achieve high precision while missing most of the positive cases.
When is precision more important?
Precision matters most when the cost of a false positive is high.
For example, imagine a model automatically blocks legitimate financial transactions when it predicts fraud. A large number of false positives could inconvenience customers and interrupt legitimate purchases. Increasing precision means a greater percentage of the transactions classified as fraudulent really are fraudulent.
Other examples where precision may be especially important include spam filtering, automated content moderation and systems where a positive prediction triggers an expensive manual investigation.
When is recall more important?
Recall matters most when the cost of a false negative is high.
Consider a preliminary screening system designed to flag potentially defective components for further inspection. Missing a genuinely defective component could be much worse than sending an occasional good component for an unnecessary second inspection.
In such a system, high recall is valuable because the model should find as many of the true positive cases as possible.
The precision-recall tradeoff
Many classifiers produce a score or probability rather than an immutable positive-or-negative answer. A decision threshold converts that score into a class prediction.
Changing the threshold can change precision and recall.
If you make it easier for the model to predict the positive class, it will usually identify more actual positives. Recall tends to increase, but additional false positives can cause precision to decrease.
If you make the model more selective about positive predictions, false positives may decrease and precision may improve. However, the model may miss more actual positives, which lowers recall.
This is why there is no universal rule that says precision should always be maximized or recall should always be maximized. The correct balance depends on the business consequences of false positives and false negatives.
What is the F1 score?
When you want one metric that considers both precision and recall, the F1 score is commonly used.
F1 = 2 × (precision × recall) / (precision + recall)The F1 score is the harmonic mean of precision and recall. It becomes high only when both metrics are reasonably high, so a model cannot obtain an excellent F1 score by having perfect precision and terrible recall, or vice versa.
For the earlier example with 20% precision and 100% recall:
F1 = 2 × (0.20 × 1.00) / (0.20 + 1.00)
   = 0.333
   = 33.3%
Precision-recall curves
Because precision and recall change as the classification threshold changes, model evaluation should not always rely on a single threshold.
A precision-recall curve plots precision against recall across many decision thresholds. It helps show how much precision must be sacrificed to achieve greater recall, and vice versa.
For classification problems where the positive class is rare, a precision-recall curve can be particularly informative because it focuses directly on performance for the positive class.
Precision-recall curve vs. ROC curve
Precision-recall curves and receiver operating characteristic, or ROC, curves evaluate different relationships.
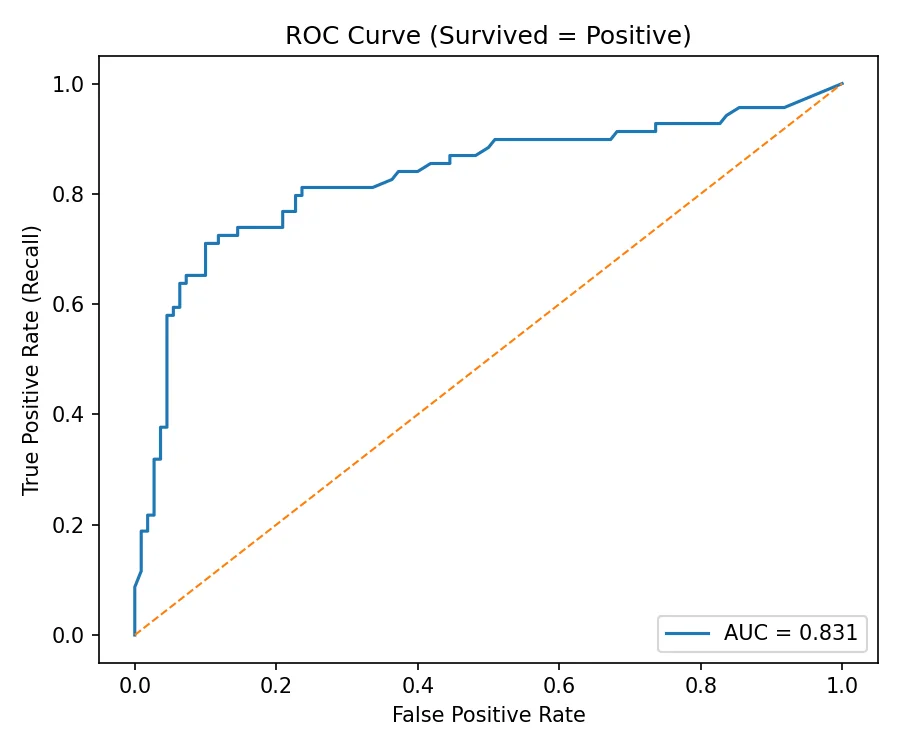
An ROC curve plots the true positive rate, which is the same quantity as recall, against the false positive rate:
True positive rate = TP / (TP + FN)

False positive rate = FP / (FP + TN)
A precision-recall curve instead plots precision against recall. When classes are highly imbalanced and the positive class is the primary concern, the precision-recall view often makes the model's positive-class performance easier to interpret.
Precision vs. recall summary
| Metric | Question it answers | Penalized by |
|---|---|---|
| Precision | When the model predicts positive, how often is it right? | False positives |
| Recall | Of all actual positives, how many did the model find? | False negatives |
| F1 score | How well does the model balance precision and recall? | Imbalance between precision and recall |
The best precision-recall balance depends on the problem. If false positives are expensive, prioritize precision. If false negatives are dangerous or expensive, prioritize recall. If both matter, evaluate both metrics together and consider the F1 score and the full precision-recall curve rather than relying on a single number.