Tuning Your Stress Test Harness
Have you ever had to stress test an application only to discover that you couldn't make sense of the results? If you have been in this situation or you are about to embark on a stress testing exercise, here are a few things that you need to consider.
Have you ever had to stress test an application only to discover that you couldn’t make sense of the results? Maybe the problem isn’t in the application. Maybe the problem was all in the way that you configured your stress test harness. If you have been in this situation or you are about to embark on a stress testing exercise, here are a few things that you need to consider.
How are you Testing?
Quite often I run into development teams that have received performance requirements such as “clients will be handling 20 customers an hour.” Teams take this requirement and try to translate it into some sort of test. The common means of performing this type of test is to make repeated requests against the server in a tight loop and see how things go. More often then not, things don’t go so well which is why I then “run into them,” as a consultant with a specialization in performance. The first question I always ask is: “How are you testing?” The answer that I’m looking for is “Well, we put the request in a loop and counted the number of requests the server could handle.” It is this type of response that tells me that the first thing that needs to be fixed is the test-harness itself.
If you are now asking yourself what is wrong with the above mentioned test procedure, don’t worry - you’re in good company. Putting together a viable stress test is not as simple a task as it would seem to be at a casual glance. The problems that one encounters can be subtle and often can only be clearly seen if one uses some not-so-simple mathematics to clarify things. But rather than watch your eyes glaze over in a complex exploration of Markov chains, state change models, queuing theory, probability distributions, etc., let’s explore a less tedious, more hand-waving explanation that hopefully will shed some light on how to fix this common problem found in many stress tests.
How You Test Affects the Test
The first thing that we need to understand is that although tests are often defined in terms of client activity, they must be viewed through a server-centric eye. The eyes of a server only see how often clients arrive and how long it takes to service each request. Let’s consider the classic example of the teller in the bank. Tellers often can’t see when you’ve arrived nor can they tell where you’ve come from. All they know is that you are here and that you are going to ask them to do something for you. Now, just how many people are in the queue depends on the rate arrive at which they and how long it takes you to fulfill their requests.
More important than how many people are in the queue is if the number of people in the room is getting smaller, staying about the same, or growing larger as the queue fills up. A complimentary question is; are people entering the queue at a rate that is slower, the same, or faster then the rate at which they are leaving? If they are leaving faster then they are arriving, then I am dealing with their requests faster then they are making them. The second case says that just as I’m finished with one client, another arrives. The final case implies that that people are coming in faster than I can deal with them. In mathematical terms, the first system is convergent, the second is in a steady state and the third is divergent. In each case, the number of people in the room is determined by Little’s Law.
You Can Only Do What You Can Do
In layman’s terms, Little’s Law says that you can only do so much work. The mathematical version reads something like this: the number of requests in a system is a product of the rate at which they arrive times the amount of time they spend in that system. If the amount of time that they spend in a system is bound by the rate at which they can flow out of the system (usually called service time), then we can determine which state a system is in by observing how often requests arrive (request inter-arrival time) and comparing that number with the service time.
In each case, Little’s Law describes how the system is coping with the workload. Though conditions may experience momentary bursts and lulls, the overall trend will be determined by the average case. For example, in a convergent system, there maybe a momentary buildup in the queue as people enter in a bunch at a time but the queue will empty out as the tendency of a convergent system is to move towards being idle. However, the third scenario is divergent in that the number of requests will continue to grow without bounds. Or will it? The answer to that question can be intertwined with how we define the universe from which our requests originate.
At some random point in time, a user from our universe will make a request. This is necessarily a server-centric point of view of the universe. What most systems count on is that at any given time, only a portion of the universe will be making requests. Experience has told us that that many internet applications find that 10% of their universe is active at any point in time. We need to know this type of information if we are going to define realistic stress tests. For example, if we have 1000 users in our universe, we will expect that 100 will be using the system at any time. Using our estimate of 10% concurrent utilization and our user base of 1000 users, our test should simulate 100 users that repeatedly perform some series of request. The danger in defining our test in the manner is that it reflects the client’s perspective.
When we move from a server-centric view of the system to a client-centric view, we can lose sight of the rate at which we are sending requests to the server. This vision is further obscured if we limit or fix the number of users (threads) we assigned to perform user requests. What we can observe when load testing under these conditions is a server handling a steady stream of requests that seemingly take longer and longer to satisfy.
Everyone is invited to the party
When we allow our simulation thread to make requests as fast as they can, we have a situation where these threads are simulating the ENTIRE universe (or more) of users all making requests all at the same time. Let’s assume a single server model because it is easier to understand; a multiple server model will work the same way, just faster. The system will queue up requests and deal with them one at a time. Once a request clears, the thread will immediately return to the head of the queue to make another request. Even though this sequence of events implies that we are working with a system in a steady-state, we are in fact working with a system that is divergent. The only reason it appears to be in a steady-state is because we have limited the number threads making requests. As was previously mentioned, in a divergent system, the response time for each successive user will be longer than that experienced by the previous one. This implies that the average response time will continue to grow without bounds. That said, we have artificially limited the number of clients and consequently the average response time will stabilize at a point that is bound by the number of clients multiplied by the time taken to service a single request. The response times being reported in this type of system includes the time spent in the queue and since we are ending up in the queue sooner then we should, we are artificially inflating that measurement. The net result is that your test is limiting your ability to determine the scaling characteristics of your system.
How do we fix this?
To fix our stress test, we need to know the rate at which users/threads are producing requests. The sum of the rates from all users translates into the rate at which the server is receiving requests. Once we’ve established this value, we can make some adjustments to rate at which the harness makes requests. The chart below demonstrates some values that one could use to maintain a rate of 50 requests per second (RPS). From the server’s point of view, the harness needs to supply a request ever 20ms. This point of view is reflected in the single threaded case. If our harness has two threads, then we should try to maintain a time interval of 40ms between requests for each thread. The table goes on to demonstrate the time interval for the case where we are using five or ten threads.
# Of threads frequency inter-request interval
Choice
Theoretically, this table shows us how we can use one, two, five, and ten threads to achieve the desired effect of maintaining fifty RPS. But what happens if the service time is greater than the inter-request interval? In this case a thread that is tied up in the server is not available to make the next request on queue and the harness will fail to deliver on the promised load of 50 RPS. To ward against this happening we need to build some slack into the system. The option to use a large number of threads is often not available to us as we will most likely be limited in the amount of hardware and/or to the number of licenses (for commercial load testing tools) that we have available. The solution is a familiar one in that we will need to strike a balance between maintaining a comfortable inter-request interval and using too many (computing/licensing) resources. We need to always be aware that a test harness that is starved for resources (wither it be hardware, software, or threads) will limit our ability to test effectively.
Measure twice, cut once
Let’s use Apache JMeter to load test an arbitrary web application to illustrate the point of just how a stress test harness can interfere with your test results. Beyond the knowledge that the entry point into the application is a Servlet, the exact details of what the application does and how it does it are of little importance to this discussion.
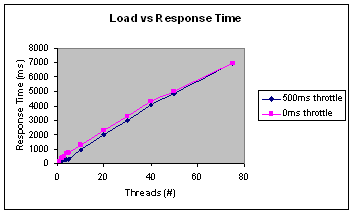
Figure 1 shows the effect of increasing the number of threads on the average response time. The results in pink were generated from threads that were not throttled. The results in blue were produced by threads that were throttled with a 500ms sleep between each request. The graph is telling us that the differences between the two result sets are marginal at best. Each result set clearly shows a marked increase in response time as load on the system is increased. Since we expect that the performance of the server will degrade as we increase the overall load, these results are not all that surprising. We only get a hint that there is a problem when we examine the results shown in figure 2.

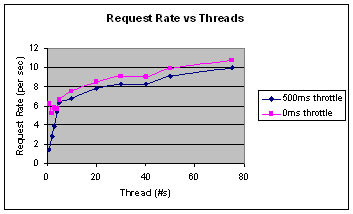
Figure 2 shows us that our ability to sustain a steady rate of requests is at first limited by the number of threads. Again this doesn’t appear to indicate a problem as it’s reasonable to assume that we would not be able to sustain any reasonable load on the server until we pass a certain threshold in the numbers of threads. The graph also shows that once we’ve passed the server’s ability to handle requests, adding more threads has a marginal effect on the overall rate at which the harness can fire requests off to the server. Next point; the longer response times reported by these “extra” threads do suggest that they have contributed to the load on the system.

The question is: how can a thread that doesn’t increase the load on the server appear to degrade the server’s performance? One possible answer is; the thread is not degrading the server’s performance but instead the thread is being queued as soon as the server has completed serving it. Since the timer measuring response time necessarily starts when the request is sent to the server and stops only when a response has been received, it must include all of the time that a thread spends in the queue waiting for service as well as the time being serviced. Since the thread is entering the system as soon as it leaves, we have created a situation where the thread must wait for every other thread to complete before it will be serviced. In this scenario, more threads translate into a longer queue and longer response times.
Little’s Law tells us that this system is divergent and from this we can conclude that the harness is interfering with our ability to locate the real bottleneck (if they even exist).
Work Slower and Get More Done
Little’s Law has two components to it, service time and frequency. If we view the world as a harness does, then we would see that we have no control over the service time. We do have control over the frequency. Since our previous work is telling us that we are going too fast (or going fast the wrong way) and the only thing we can control is frequency, the only thing we can do is to go slower. We can achieve this by inserting a pause between each request. This will slow down the rate at which a single thread triggers a request. The pause should reduce the time that the thread spends in the queue thus giving us a more realistic response time.
For this test we will start with fifty threads throttled to generate nine requests for second. These values can be adjusted if we find that we cannot maintain a reasonable request rate. Response times will be used to gauge how well things are going. The last thing to set is our pause times. We can use the data from the previous runs to help us make that decision.
Referring back to figure 1 we can see that eight to nine RPS should result in a response time of 2 to 3 seconds. Little’s Law tells us that we would want enough threads so that one is free to enter the system sometime after the two to three second time frame (assuming that we can improve on the average response time). Thus our average pause time should be about 3 seconds. For the purposes of this exercise we’ll run a series of tests to explore a range of values.
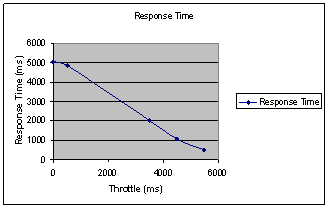
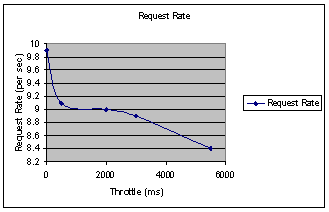
The first test uses a randomly chosen value between two and five seconds. Values in this range should produce an average pause time of 3.5 seconds. We can use this information to calculate a theoretical rate of requests by taking 50 (number of threads) and dividing it by 3.5 + 2 (a guess at our target response time). This should give us a value of 9.1 RPS. The second test used a random value in the range of three to six seconds. Our final test uses values between four to six seconds. The results of these tests can be seen in figure 3.

The message in figure 3 is increasing the duration of the pause will result in shorter average response times. However this information needs to be tempered with the information presented in figure 4. In figure 4 we can see that we failed to maintain the desired rate of requests made against the server when pause time was increased to 4-7 seconds. We could increase the load by adding more threads but there is minimal value in taking this step as the tests do give us a configuration that works.

This series of experiments has helped to move the stress test to a healthier configuration. Our conclusion? We should configure our test harness to use fifty threads each sleeping between three and six seconds.
Final Word
Before one start on a performance tuning exercise (or benchmarking effort for that matter), one needs to confirm that the harness does not interfering with the test. A well configured harness will not cause us to measure things that we shouldn’t measure. A test harness that is unable to deliver the appropriate load or causes us to measure accidental response time will interfere with our efforts to performance tune our application. The key to understanding if this is happening is to measurement the effectiveness of the harness at driving traffic. This effectiveness can be determined by the harnesses ability to meet and sustain the desired number of transactions or requests per seconds. The harness should not be turning threads over right away (to make the next request). If this is happening, we need to slow down the harness so that it is not artificially flooding the server beyond its capacity. It is often necessary to experiment to achieve a properly balanced configuration for the test harness. In the early phases of testing, don’t focus on response times (these will improve as you work your way through the process of tuning the application) but instead focus on getting the harness right. Finally, don’t be afraid to slow things down as doing so maybe instrumental in helping you to understanding what is affecting the performance of your applications.
Biography
Kirk Pepperdine is the Chief Technical Officer at JavaPerformanceTuning.com and has been focused on Object technologies and performance tuning for the last 15 years. Kirk is a co-author of the book ANT Developer's Handbook (SAMS). Contact Kirk at [email protected].


